Saona Island Coastal Bathymetry: Seafloor Depth Mapping, Underwater Terrain and Marine Navigation
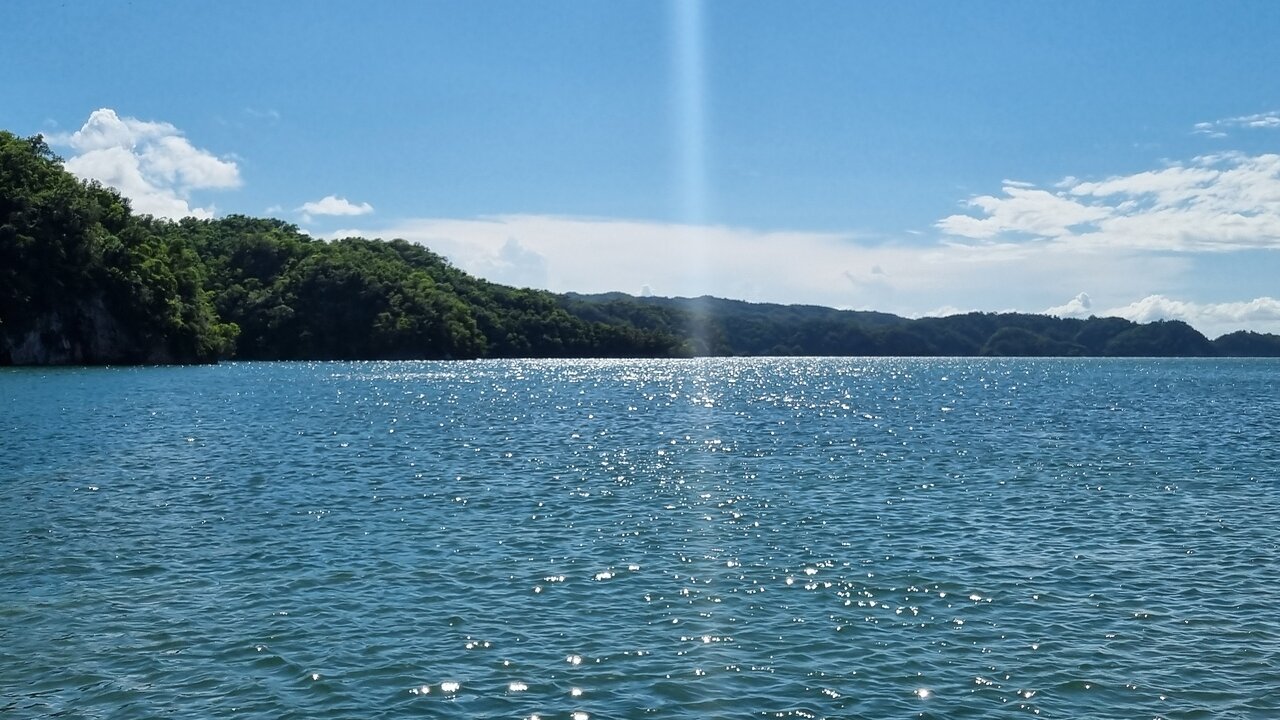
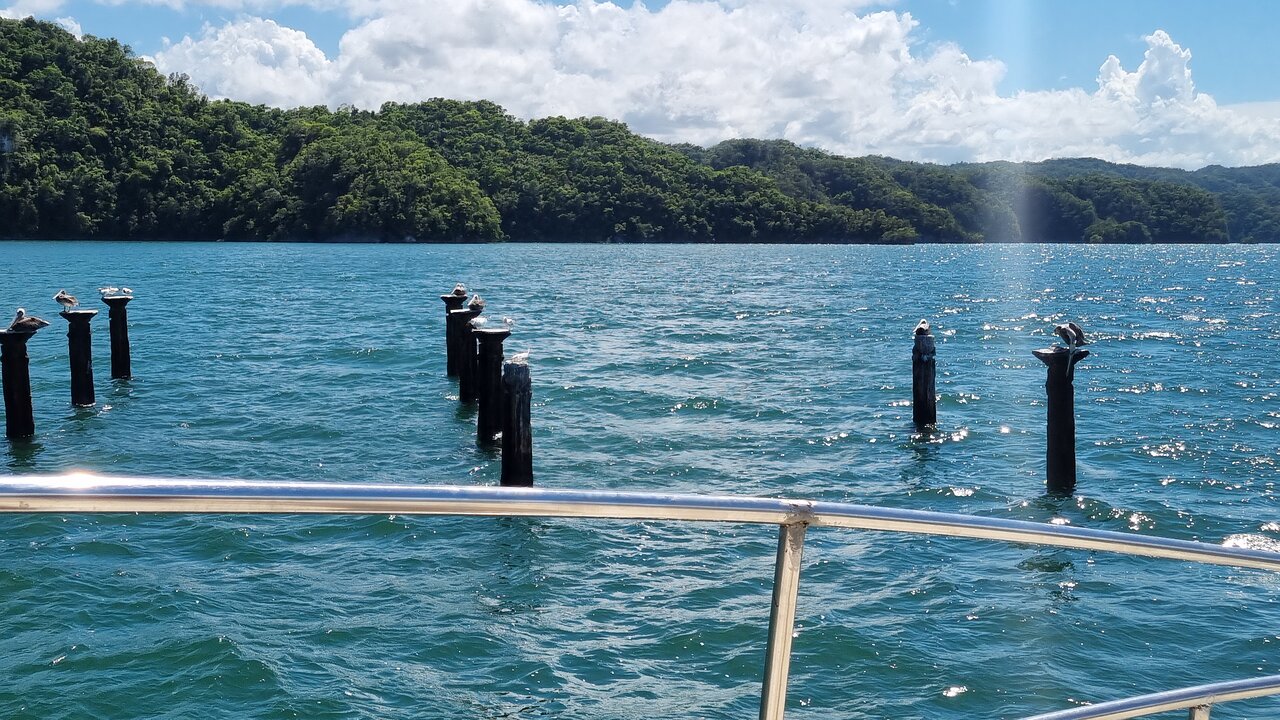
Saona Island, located off the southeastern coast of the Dominican Republic, is widely associated with tropical beaches, clear Caribbean waters and marine environments. Yet beneath the visible ocean surface lies another landscape: the underwater terrain of the seabed.
Scientists describe the measurement and mapping of underwater depth as bathymetry. Similar to how topographic maps represent hills, valleys and elevations on land, bathymetric maps show the depth, shape and relief of the seafloor.
Coastal bathymetry is important for understanding underwater landscapes, supporting safe navigation, studying marine habitats and planning coastal infrastructure. Around an island environment such as Saona Island, accurate depth information can help researchers understand how shallow and deeper areas connect.
This guide explains the science, technology and practical applications of coastal bathymetry without assuming that particular underwater depths or landforms have been verified around Saona Island.
1. What Is Coastal Bathymetry?
Bathymetry is the measurement of water depth and the representation of underwater terrain.
A bathymetric survey collects depth measurements at known geographic positions. When enough measurements are combined, they can create a map or digital model of the seabed.
Coastal bathymetry is especially concerned with relatively shallow marine environments near coastlines, islands, reefs, bays and other coastal features.
A bathymetric map can represent:
- Shallow and deep areas
- Underwater slopes
- Seafloor depressions
- Submerged ridges
- Channels and underwater valleys
- Reef structures and other seabed features, where detected
- Changes in seabed elevation
Bathymetry is not the same as measuring water clarity or sediment particle size. It describes the depth and shape of the underwater surface.
2. Why Is Bathymetry Important Around Islands?
Island coastlines often contain a mixture of shallow and deeper marine environments. Knowing how the seabed changes with distance from shore is useful for several reasons.
Safe marine navigation
Boats need reliable depth information to reduce the risk of grounding. Shallow areas, submerged obstructions and underwater slopes can affect which routes are suitable for a vessel.
Hydrographic surveys help provide the depth information used in nautical charts and other navigation products.
Marine habitat research
Seafloor depth and shape influence the physical environment in which marine organisms live. Different depths can receive different amounts of sunlight and experience different wave and current conditions.
Bathymetric information can help researchers identify areas that may be suitable for further investigation of coral habitats, seagrass environments and other marine ecosystems. A depth map alone, however, cannot confirm the presence or health of a particular habitat.
Coastal planning
Bathymetry can support the assessment of coastal infrastructure, marine access routes, shoreline projects and potential dredging areas.
Environmental monitoring
Repeated surveys can help identify changes in seabed elevation. These changes may be associated with sediment movement, erosion, deposition, storms or human activities.
3. How Do Scientists Measure Underwater Depth?
Several methods can be used to measure the depth of the ocean. The appropriate method depends on water depth, survey objectives, required accuracy, water conditions and available equipment.
Single-beam echo sounder
A single-beam echo sounder sends an acoustic pulse toward the seabed and records the returning echo.
The instrument measures the time required for the sound signal to travel from the vessel to the seabed and back.
A simplified depth equation is:
Depth = (Sound speed × Two-way travel time) / 2
The division by two is necessary because the sound travels downward and then returns upward.
Single-beam systems generally collect depth measurements along the vessel's survey track. They are useful for many depth-measurement tasks, but the space between survey lines may remain unmapped unless additional lines are collected.
Multibeam echo sounder
A multibeam echo sounder sends multiple acoustic beams across a wide area beneath a survey vessel.
Instead of measuring only a narrow area directly below the vessel, it collects a fan-shaped swath of depth measurements.
This allows surveyors to build detailed representations of the seabed over a broader area.
Multibeam systems are particularly useful when a survey requires extensive seabed coverage or detailed underwater terrain information.
Satellite-derived bathymetry
In suitable shallow-water conditions, satellite imagery can help estimate underwater depth.
The method uses the relationship between reflected sunlight and water depth. Light behaves differently as it travels through water, and the resulting satellite signals can be processed to estimate depth.
Satellite-derived bathymetry can be useful for broad-area mapping, reconnaissance and preliminary coastal studies.
However, its accuracy depends on water clarity, bottom reflectance, depth, atmospheric conditions, image quality and calibration data. It is not a universal replacement for direct hydrographic measurements.
Airborne bathymetric LiDAR
Bathymetric LiDAR uses laser pulses from an aircraft to measure water depth in suitable shallow environments.
Some laser energy reflects from the water surface, while another portion may reach the seabed. The time difference between these returns helps estimate depth.
Its effectiveness depends on water clarity, depth, bottom characteristics and system capabilities.
4. How Does Sonar Calculate Depth?
Sonar stands for Sound Navigation and Ranging. It uses sound waves to detect objects or measure distances underwater.
A basic echo-sounding system follows four steps:
- A transducer sends a sound pulse into the water.
- The sound travels downward toward the seabed.
- The seabed reflects part of the sound energy.
- The transducer receives the returning echo and records its travel time.
The instrument uses the estimated speed of sound in water to calculate distance.
Sound speed is not perfectly constant. It varies with water temperature, salinity and pressure. Therefore, hydrographic surveyors may collect sound-speed profiles to correct their acoustic measurements.
Without appropriate corrections, sound rays can bend as they travel through water, affecting the calculated position and depth of the seabed.
5. The Role of GPS and GNSS Positioning
A depth measurement is much more useful when its geographic position is known.
Global Navigation Satellite Systems (GNSS), including GPS, provide positioning information for the survey vessel.
During a hydrographic survey, positioning equipment records where each depth measurement was collected.
Survey systems may also include motion sensors that measure vessel movement, including:
- Roll: side-to-side rotation
- Pitch: forward-and-backward rotation
- Heave: vertical movement
- Heading: the direction in which the vessel is pointing
These measurements help correct the depth data for vessel movement and sensor orientation.
The final dataset combines geographic position, depth, time and relevant corrections.
6. Why Water Level and Tidal Datums Matter
Water depth changes with the water level. A depth measurement collected at one time may not be directly comparable with a measurement collected at another time unless the water-level reference is understood.
Hydrographic surveyors therefore relate depth measurements to an appropriate vertical reference, often a chart datum for nautical charting.
Depending on the survey method, water-level observations or a verified relationship between GNSS heights and the vertical reference may be used.
A vertical datum is not simply the water level observed at the moment of measurement. It is a defined reference surface used to make measurements consistent.
When comparing bathymetric datasets, researchers should check whether the surveys use the same vertical datum and correction methods.
7. What Does an Underwater Terrain Map Show?
A bathymetric map can show much more than isolated depth readings.
Depth contours
Contour lines connect locations with equal water depth. They help readers understand how quickly the seabed becomes deeper or shallower.
Closely spaced contours usually indicate a steeper underwater slope, while widely spaced contours generally indicate a gentler slope.
Shaded relief
Shaded-relief maps use simulated illumination to make underwater slopes and landforms easier to interpret.
They can help highlight ridges, depressions and other changes in seabed shape.
Digital bathymetric models
A digital bathymetric model is a gridded representation of seabed depth.
Each grid cell contains a depth or elevation value. The model can be displayed as a color-coded map or used for additional spatial analysis.
Its usefulness depends on the quality, resolution, coverage and uncertainty of the source measurements.
8. How Bathymetry Supports Coral Reef and Seagrass Research
Underwater depth is an important environmental variable for marine habitat studies.
Coral reef research
Depth can influence sunlight availability, water movement and the physical conditions experienced by coral communities.
Researchers may combine bathymetric maps with underwater photography, sonar backscatter, field observations and habitat surveys.
Bathymetry alone cannot identify every coral species or establish reef health, but it provides an important spatial framework for further investigation.
Seagrass research
Seagrass requires suitable underwater light conditions. Water depth can affect how much sunlight reaches the seabed.
A bathymetric model can therefore help researchers examine the physical setting of potential seagrass habitats.
However, field verification is needed to establish actual seagrass presence, coverage and condition.
Habitat mapping
Combining depth data with acoustic backscatter and biological observations can improve seabed classification.
Acoustic backscatter measures the strength of returned sound energy. Different seabed materials and structures can produce different acoustic responses, although interpretation requires careful calibration and ground-truthing.
9. How a Coastal Bathymetric Survey Could Be Designed for Saona Island
A scientific bathymetric investigation around Saona Island would begin with a clear survey objective.
For example, the objective might be to prepare a general seabed-depth model, investigate a specific coastal area or collect data for a habitat study.
A practical survey workflow could include the following stages.
Stage 1: Define the survey area
Surveyors establish the geographic boundaries, required depth range, intended use and expected level of detail.
Stage 2: Review existing information
Available nautical charts, previous survey records, satellite imagery and coastal datasets can help identify data gaps and plan the fieldwork.
Stage 3: Select equipment
A single-beam system may be suitable for some survey objectives. A multibeam system may be selected when broader seabed coverage and detailed terrain representation are required.
Stage 4: Calibrate the equipment
Surveyors check instrument offsets, positioning systems, vessel motion sensors and acoustic measurements.
Stage 5: Collect depth measurements
The vessel follows planned survey lines while the system records depth, position and time.
Stage 6: Apply corrections
Data processing may account for sound speed, water level, vessel movement, sensor alignment and other relevant measurement effects.
Stage 7: Process and validate the data
Surveyors inspect the measurements for errors, outliers, gaps and inconsistencies. Independent checks and overlapping survey lines can help assess data quality.
Stage 8: Create the final bathymetric model
Validated measurements are converted into depth contours, gridded surfaces, shaded-relief maps and other suitable products.
Stage 9: Document the results
The final dataset should describe its survey dates, equipment, coverage, coordinate reference system, vertical datum, resolution and uncertainty.
10. What Can Affect Bathymetric Accuracy?
Bathymetric measurements contain uncertainty. A professional survey must identify and manage important sources of error.
Common factors include:
- Incorrect sound-speed estimates
- Changes in temperature and salinity
- Poor positioning quality
- Vessel roll, pitch and heave
- Incorrect transducer offsets
- Unreliable water-level corrections
- Weak seabed acoustic returns
- Insufficient survey-line coverage
- Incorrect processing or interpolation
- Changes in the seabed between survey dates
A detailed-looking map is not automatically an accurate map. The survey method, measurement density, uncertainty and quality-control procedures are essential to understanding what the data can reliably show.
11. Bathymetry, Navigation and Responsible Marine Tourism
Bathymetric information can support marine navigation and coastal management, but visitors should not treat a general bathymetric image as a substitute for current official navigation information.
Water depth can vary over time, and a map may not show every recent obstruction or change in seabed conditions.
Boat operators should use appropriate official nautical charts, current navigation information and local maritime guidance. A recreational depth sounder is useful for situational awareness, but it does not necessarily provide the coverage or quality assurance of a professional hydrographic survey.
For marine tourism, reliable coastal information can contribute to better planning and awareness of underwater hazards.
12. How Climate and Coastal Processes Can Change the Seabed
The seabed is not always static.
Storms, waves, currents, sediment transport and coastal construction can change underwater terrain.
A storm may redistribute sediment, while long-term coastal processes can gradually alter underwater slopes and channels.
Repeated bathymetric surveys can help researchers compare seabed conditions over time.
To make a meaningful comparison, datasets should use compatible reference datums, adequate spatial resolution and documented uncertainty. Otherwise, differences between maps may reflect survey methods rather than real seabed change.
13. The Future of Coastal Bathymetric Mapping
Bathymetric technology continues to develop.
Modern hydrographic projects may combine multibeam sonar, satellite imagery, airborne LiDAR, GNSS positioning, motion sensors and geographic information systems.
Automated processing can help surveyors handle large datasets, while improved visualization makes underwater terrain easier to interpret.
Machine-learning methods may also assist with seabed classification and data-quality checks. However, automated results still require validation and should not replace professional survey judgment.
For island environments such as Saona Island, better coastal mapping could support marine research, navigation planning and environmental management when surveys are properly designed and verified.
Frequently Asked Questions
What does bathymetry mean?
Bathymetry is the measurement and mapping of underwater depth and seafloor shape. It is the underwater equivalent of land topography.
How is ocean depth measured?
Ocean depth can be measured using echo sounders, sonar systems, satellite-derived methods, airborne LiDAR and other survey techniques.
What is the difference between single-beam and multibeam sonar?
Single-beam sonar measures depth within a narrow area beneath the survey vessel. Multibeam sonar collects many depth measurements across a wider swath of seabed.
Why is bathymetry important for marine navigation?
It helps identify water depths, underwater slopes, shallow areas and potential obstructions, supporting the preparation of nautical charts and navigation information.
Can satellite images measure underwater depth?
Yes. Satellite-derived bathymetry can estimate depth in suitable shallow-water environments, but its accuracy depends on water clarity, bottom reflectance, depth and calibration.
Does a bathymetric map show coral reefs?
A bathymetric map shows seabed depth and shape. It may help identify areas for reef investigation, but biological surveys are needed to confirm coral presence and condition.
Are detailed bathymetric measurements available for every part of Saona Island?
Not necessarily. The availability, coverage, age and quality of survey data must be checked against the relevant hydrographic data sources. A general map should not be assumed to represent a recent, high-resolution survey.
Conclusion
Coastal bathymetry reveals the underwater landscape that cannot be seen from the beach or a boat's surface. Through sonar, GNSS positioning, water-level corrections and careful data processing, hydrographic surveyors can create detailed representations of seafloor depth and shape.
For Saona Island, bathymetry is a valuable subject for understanding coastal geography, marine research, habitat assessment and navigation. However, reliable conclusions about local underwater terrain require verified survey data rather than assumptions based on appearance or generalized maps.
By combining accurate depth measurements with ecological observations and responsible coastal planning, bathymetric mapping can contribute to a better scientific understanding of the marine environment around Saona Island.
Local explorer & expert guide in Birdwatching Guide.